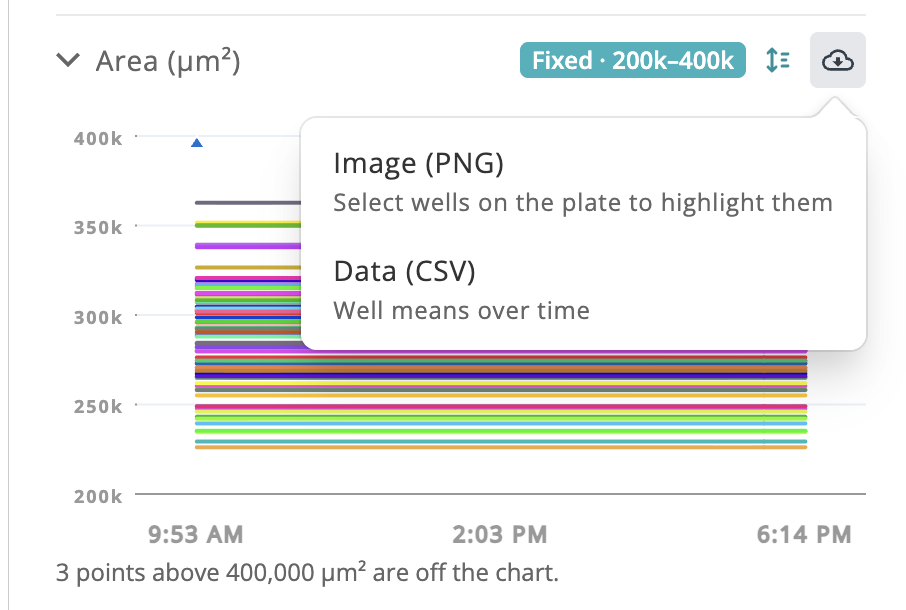
Metric graphs and the Confluence overlay graph have a download menu. PNG saves the graph with a title, legend and any fixed Y range, at the same plot size every time so graphs from different plates line up side by side. CSV saves exactly the values that are plotted. Selected wells keep the same colors across metrics, and the Confluence graph now highlights the wells you've selected on the plate.