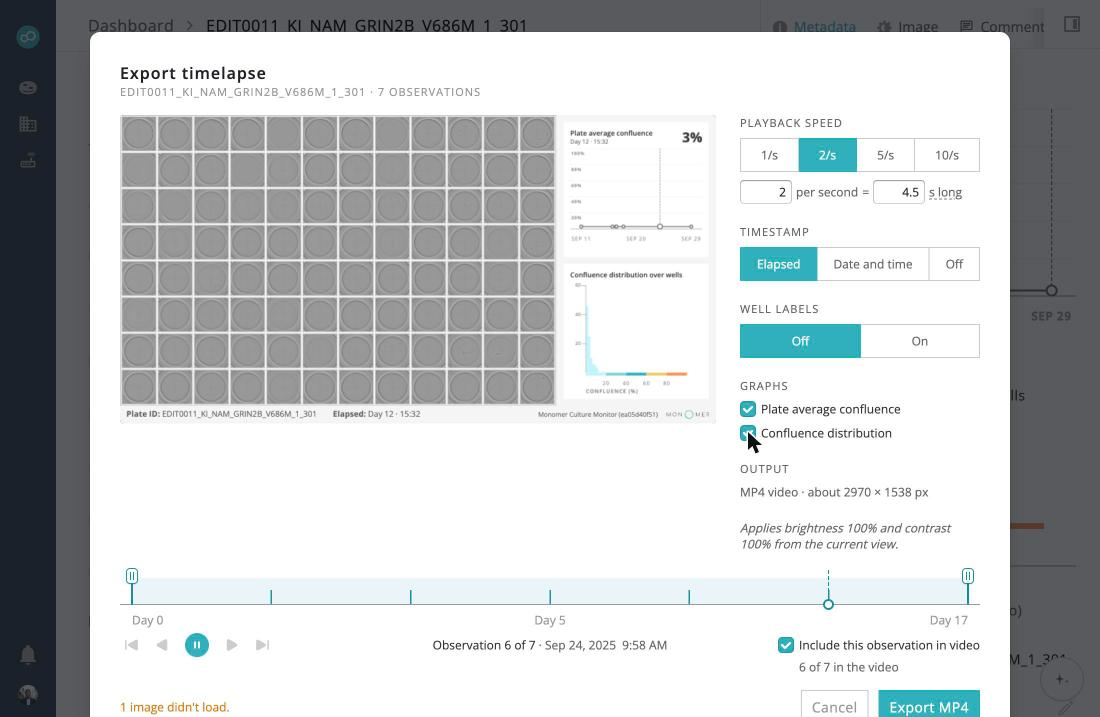
The plate export dialog has a new Graphs section, off by default and shown only for plates with confluence data. Pick the plate-average line over the whole run, with a marker at the current frame, the current observation's per-well histogram, or both. They appear beside the plate grid in the preview and in the MP4. Exports with graphs take longer while each frame's graphs are drawn. Plate exports now start on the Elapsed timestamp, and the line graph in the Culture Status overlay shows its y-axis labels again.